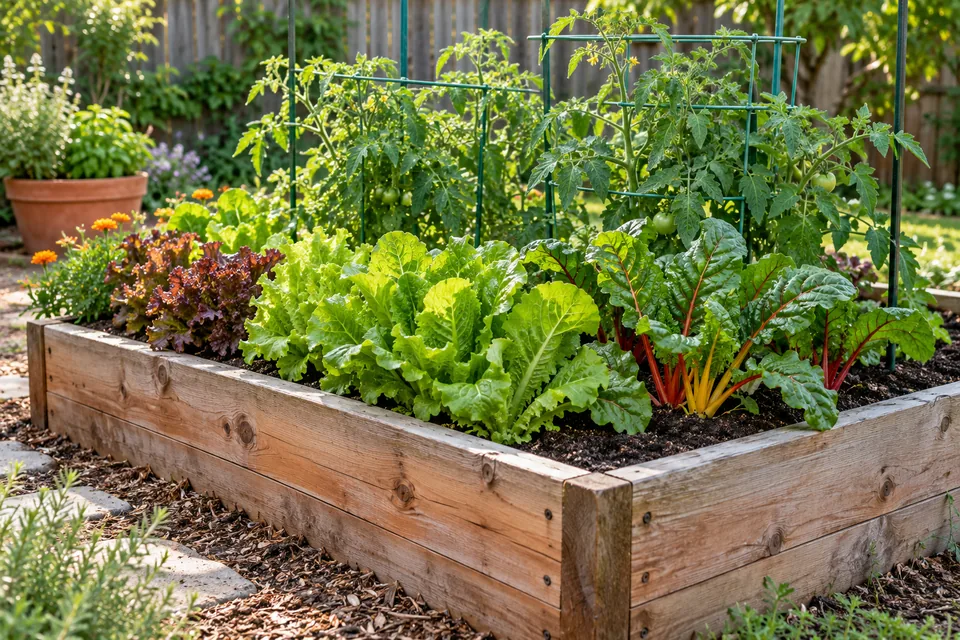
Build the calendar from local measurements. "Sow tomatoes in May" applies only to a narrow climate band; soil temperature, freeze probability, and crop requirements produce the correct date for your garden.
This guide covers those signals — freeze probability, soil temperature, degree days, phenology, chill accumulation — and then a four-phase working cycle you can run against them.
Where to actually look things up
Start here, because every other section depends on it. These are free, public, and specific to your location.
- Freeze dates and probabilities: NOAA's National Centers for Environmental Information publishes US Climate Normals for 1991–2020, including agricultural normals with freeze probabilities; the frost date lookup pulls the 50 and 10 percent dates for the stations nearest your ZIP code. Your local National Weather Service forecast office often publishes a frost and freeze climatology page for nearby stations, which is the easiest route in.
- Winter hardiness: the USDA Plant Hardiness Zone Map (2023 revision), searchable by ZIP code.
- Soil temperature: your own thermometer first. For orientation, search for your state's mesonet or agricultural weather network, several of which publish soil temperature alongside air temperature.
- Pest and crop timing: degree-day tools such as Cornell's NEWA network and UC IPM's pest and plant models.
- How your spring is running this year: the USA National Phenology Network's Status of Spring maps.
- Everything local: your state Cooperative Extension service's planting calendar and its Master Gardener program. This is the tiebreaker.
Frost dates are probabilities, not dates
The single most useful correction in garden planning is this: the "last frost date" you have been given is almost certainly the 50 percent date. Frost occurs after it in roughly half of all years. That is not a flaw in the number; it is what the number means, and it is why frost protection is worth having ready.
Freeze dates are conventionally computed at several probability levels — commonly 90 percent (very likely), 50 percent (a coin flip), and 10 percent (unlikely). NCEI's 1991–2020 agricultural normals publish the dates past which the chance of a freeze drops below 40, 30, 20, and 10 percent, drawn from more than 15,000 stations with percentiles for each day of the year.
So pick your probability to match your stakes. Cheap, re-sowable seed can go in around the 50 percent date. Irreplaceable transplants, a grafted tree, or the one tomato variety you waited all winter for should wait for the 10 percent date, or go out with protection ready.
Frost, freeze, and hard freeze are different events
The distinctions change what you do about them.
| Event | Definition | What it means for you |
|---|---|---|
| Frost | Ice crystals forming on surfaces, driven mainly by radiational cooling, when the surface is below 32°F | Because it is a surface effect, your thermometer can read the mid-30s and your basil can still be killed |
| Freeze | Air temperature 32°F (0°C) or below over a widespread area for a significant period — usually the term used when wind or conditions prevent frost forming | Covers help less; the whole air mass is cold |
| Hard freeze | Typically 28°F (−2°C) or lower for at least an hour | Destroys most seasonal vegetation. The practical end of the warm-season garden, and the point to drain irrigation |
The mechanism matters too. A radiative freeze happens on clear, calm nights as surface heat escapes to the sky, and a warmer layer of air typically sits above the surface. That is why a cover — which traps outgoing radiation — works well on those nights. An advective freeze imports cold air on strong winds, mixing away small-scale differences. In an advective freeze, microclimate advantages, frost cloth, and air-moving tricks all lose most of their value. When the forecast is cold and windy, protect less and accept more.
What a hardiness zone does and does not tell you
The USDA Plant Hardiness Zone Map is built from 30-year averages of the lowest annual winter temperature, using 1991–2020 station data. Zones are 10°F wide, subdivided into 5°F half-zones. It is a winter-survival index and nothing else.
It does not tell you your last frost date, your season length, your summer heat, your rainfall or humidity, or your soil. Using a zone to decide when to plant is the most common planning error in American gardening.
Two further limits are worth knowing, both stated by USDA itself. First, the map "does not reflect the coldest it has ever been or ever will be at a specific location, but simply the average lowest winter temperature over a specified time." Second, cold hardiness is acquired gradually through autumn as days shorten and lost gradually in late winter — so an extreme cold snap early in autumn, or a warm midwinter spell followed by a sharp return to cold, can kill a plant that never saw its zone's average low. That mechanism explains most "but it was rated for my zone" losses.
The 2023 map is drawn on a half-mile grid, the finest to date, and USDA notes plainly that microclimates smaller than that will not appear — heat islands from blacktop and concrete, and frost pockets in small hills and valleys. That is an invitation to map your own site, which the next section takes up.
Heat is a separate axis entirely. The American Horticultural Society's Plant Heat Zone Map divides the country by the average annual number of days above 86°F, a widely cited threshold for the onset of heat stress. A plant tag carrying both a hardiness zone and a heat zone is describing two different ways the plant can die.
Soil temperature: the best substitute for a date
"After the soil has warmed" appears in every planting guide and is almost never quantified. It is the most actionable signal available to a home gardener: cheap to measure, specific to your beds, and directly predictive of what seed will do.
How to measure. Take readings at 2 inches (5 cm) deep for seed sowing, using a soil thermometer or a digital probe. Read at the same time on several consecutive days rather than once — published extension protocols vary between three consecutive mornings and seven consecutive days, and between mid-morning and midday, so the principle to carry is a fixed hour, repeated, showing a trend. Measure in your own garden; regional feeds are for orientation only.
Soil temperature lags air temperature substantially because of soil mass and moisture, so a warm week does not mean warm soil. Exposure matters too: bare ground and ground under black plastic warm much faster than ground under light-colored mulch, which is why pulling mulch back a couple of weeks early is a legitimate season-extension move.
| Soil temperature | What it supports |
|---|---|
| 35–40°F (2–4°C) | Bare minimum at which cool-season crops will germinate — slowly, and at real risk of rotting |
| 40–50°F (4–10°C) | Direct-seed peas, spinach, lettuce, radish |
| 50–60°F (10–16°C) | Floor for warm-season crops. A floor, not a target |
| 65–75°F (18–24°C) | Good working range for cool-season crops |
| Around 85°F (29°C) | Optimum for bean, eggplant, pepper, tomato, sweet corn |
The tomato illustrates the rule. Its optimum germination range is 65–85°F, where it emerges in about six to eight days. At 50°F the same seed can take over 40 days. At 104°F, germination stops. Same seed, same soil, same gardener — a fivefold difference in emergence time, driven entirely by a number you can measure in thirty seconds.
"Will germinate" and "germinates well" are different questions, and conflating them is why impatient early sowings rot in the ground.
Growing degree days: anticipating pests and stages
Insects and plants develop on accumulated heat, not on dates, which is exactly the problem this article is about. Growing degree days make that measurable.
The arithmetic is one line: (daily maximum + daily minimum) ÷ 2 − base temperature. A day averaging 51°F, against a 50°F base, accumulates one degree day. Base temperatures are species-specific — codling moth development, for instance, does not progress below 50°F, and its model also uses an upper threshold of 88°F, because development stalls in extreme heat too.
You do not need to do the arithmetic yourself. Cornell's NEWA network and UC IPM both publish running accumulations tied to weather stations, with models you can select by pest and location.
Set the model's biofix from the specified local event, such as sustained first moth capture, and use the result to schedule scouting. A degree-day threshold identifies the week of likely activity, not the exact moment an insect emerges. When the model reaches the threshold, inspect the plants or traps and act on what you find.
Phenology: what the season is doing this year
Degree days tell you about heat. Phenology tells you what plants and insects have actually done, which is the integrated result of everything.
The USA National Phenology Network publishes Status of Spring maps showing when spring leaf-out and bloom have arrived this year and how that compares with the long-term average — early shown in orange, late in purple. In February you can see whether your spring is running ahead or behind, which no calendar can tell you.
The indices are built on named indicator species: the First Leaf Index on leaf-out of lilacs and honeysuckles, the First Bloom Index on their flowering. Naming the species is what makes the index checkable in your own garden — you can watch the same plants the model watches. Nature's Notebook, the network's observation program, is where your notes become data other people can use.
Chill: the signal that decides fruit choices
For fruit trees the binding constraint is often winter, not summer. Insufficient chilling produces specific, diagnosable symptoms — delayed and extended bloom, delayed foliation, reduced fruit set, and poorer fruit quality.
The complication is that "chill hours" is not one measurement. Three older models are in common use: hours below 45°F; hours between 32°F and 45°F; and the Utah model, which weights temperature bands differently and subtracts for warm spells. A chill-hour figure means nothing unless you know which model produced it, and nursery catalogs rarely say.
The Dynamic Model, which reports chill portions, was developed to address exactly those problems: it accumulates chill below a threshold but can cancel accumulation if cold is followed by warmth within a 24-hour window. It has produced both more consistent accumulation across years and better bloom-date predictions than the chilling-hours and Utah approaches, and it is the better-supported approach in warm-winter regions.
When matching a cultivar to a site, weigh four axes together rather than one: growing-season length, disease pressure, chill requirement, and hardiness zone.
Set your own local anchors
With the lookups above, write down for your site: the 50 percent and 10 percent spring freeze dates, the first-fall-freeze date, your hardiness zone, and your typical season length. Then add what only you can supply — a map of your own microclimates.
Walk the site over a year and note where frost lingers in the morning, where snow melts first, which beds bake against a south wall, where cold air pools at the bottom of a slope, where wind funnels between buildings, and when shade reaches each bed at different times of year. USDA's own admission that its half-mile grid cannot resolve frost pockets and pavement heat islands is your license to trust these observations over the map.
A south-facing wall bed and a low corner of the same garden can differ by more than a hardiness half-zone. Use the warm spots to push the season and the cold spots for crops that want it.
A four-phase cycle — run per season, not per year
The cycle below repeats around each growing season your climate has. Read "quiet period" as your quiet period. In much of the country that is winter. In the Gulf and Deep South there are two planting seasons around a summer that is a survival period rather than a growing one. In the low-desert Southwest, autumn is the main planting season. In Mediterranean California, winter is a growing season. At high elevation there is one short window and no second chances.
Phase 1: review and reset
During the quiet period, clear failed plantings, check structures and tools, and take stock of seed. Rather than guessing at stored-seed viability, run a germination test: ten seeds on a damp paper towel in a bag somewhere warm, counted after the days-to-germination on the packet. That number tells you whether to sow thicker or replace the packet.
Choose crops and cultivars against your anchors — season length, chill, disease pressure, hardiness — and sketch where things will go. Order seed early enough that a sold-out variety does not become a plan change in April.
Phase 2: prepare and establish
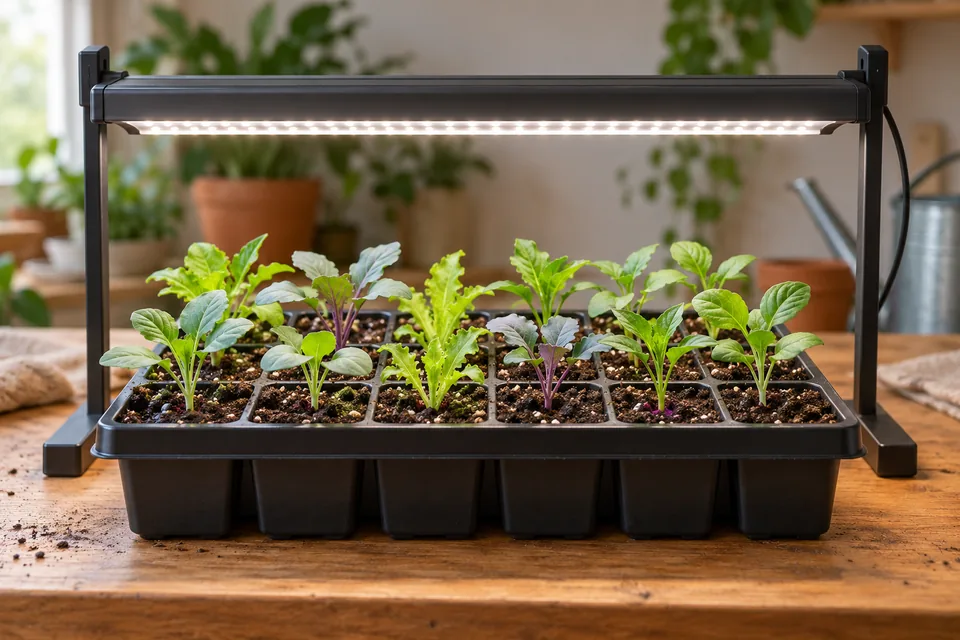
Work soil only when it crumbles rather than smears. Start seedlings indoors on a schedule counted backward from your target transplant date, not forward from an arbitrary start. The seed starting calculator does the counting.
Harden off properly, allowing 7 to 14 days. Two published protocols both work: begin with an hour outdoors in a protected spot and increase exposure by one to two hours daily; or start with two to three hours during the warmer part of the day and build from there. Work up to 10 to 12 hours a day, then leave plants out for a full 24 hours for a couple of days before planting. The hardening site should be shaded and sheltered — wind, not cold, is what most often wrecks softly grown transplants.
Hardening off is not a ritual. It slows growth, thickens the cuticle and waxy layers, stimulates root development, raises carbohydrate reserves, reduces freeze-prone water in cells, and develops lignin in cell walls. Skipping it is why transplants stall for three weeks.
Then sow against soil temperature and set out warm-season crops when the soil floor is met and the freeze risk matches your tolerance.
Phase 3: maintain and observe
Water by checking the root zone rather than by schedule. Keep the soil surface covered. Weed while weeds are small.
Sow successions as you go: radish and sweet corn every 7 to 10 days, carrots and corn every 7 to 14, lettuce roughly every 10 to 14. A two-week interval is a serviceable default when you do not want to think about it per crop. Relay planting overlaps crops rather than sequencing them — sowing beans a week or two before the early cabbage comes out, or leaving room in a staggered broccoli planting to slot in lettuce.
Scout weekly with a purpose. Turn leaves over. Note what you find and when, and use your degree-day tool to know which week to start watching for a specific pest rather than discovering it at peak.
Phase 4: harvest, transition, and protect
This phase starts in midsummer, not at harvest, because the hard planning skill is deciding in July what will still mature before the first freeze.
The method: take your first-freeze date and count backward, the way the July and August guides do for fall crops, by the days to maturity plus a harvest-period allowance — Georgia's extension service publishes 18 days as its figure, giving a worked example of snap beans at 55 days with a November 15 frost date, sown on or before September 3. Then add more time, because autumn growth is slower in cool weather, and more again for tender crops that cannot take even a light frost.
Two traps to avoid. Days to maturity is counted from sowing for direct-seeded crops and from transplanting for transplanted ones — mixing these up costs four to six weeks. And the branch point is frost tolerance: crops that improve after a light frost can be planned right up to the frost date, while tender crops must finish before it.
For protection, know what the equipment buys you:
- Floating row cover: roughly 2 to 8°F of frost protection depending on fabric weight — about 2°F for lightweight, and sources give heavyweight anywhere from 4 to 10°F, so treat it as "a few degrees, more with heavier fabric." Under cover, nights run about 3 to 5°F warmer and days more than 10°F warmer, so covers advance growth more than they prevent damage.
- Low tunnels: up to about 8°F, largely by preventing ground heat escaping to the sky — which is exactly why the protection collapses on windy nights.
- Plastic on a frame: Colorado State trials found 3°F to over 6°F.
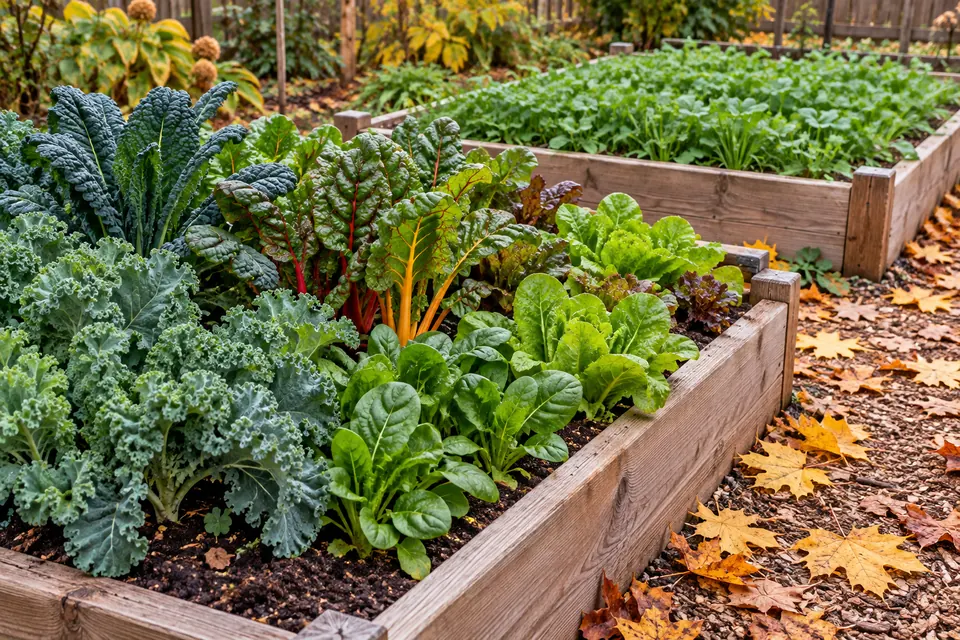
Then close the season deliberately: sow a locally adapted cover crop early enough to establish, or mulch the bed when the planting window has passed. Rotate the next crop family into a different bed, drain and store irrigation before a hard freeze, clean and sharpen tools, and remove diseased material rather than composting it. Rodale Institute's rotation and cover-crop guidance uses this transition to protect soil, interrupt pest cycles, and keep living roots working between cash crops.
Keep the notes that change decisions
Most garden journals record what happened. The useful ones record what would change a decision. Six fields are enough:
- Soil temperature at sowing, and the depth you measured.
- Sowing date versus emergence date — the gap shows whether you sowed too early.
- Observed frost dates at your site, next to the station normal. After a few years you will know your own offset.
- What was blooming, or the degree-day accumulation, when you first saw a given pest.
- Cultivar performance, with the specific failure named — bolted, cracked, poor set, disease.
- Whether an intervention changed anything. This is the field people skip and the only one that improves judgment.
One more thing worth knowing: the normals themselves move. They are recomputed on a rolling 30-year window, so advice written against an older window drifts out of date without anyone noticing. Your own records, taken at your own site, do not have that problem.
The goal is not a perfect calendar. It is a shorter list of decisions you have to guess at.
Sources and further reading
- Rodale Institute: Cover crops — keeping soil covered and rooted between production crops.
- Rodale Institute: Crop rotations — planning crop sequence to improve soil and interrupt pest cycles.
- NOAA NCEI: US Climate Normals, 1991–2020 — including agricultural normals and freeze probabilities.
- NOAA NCEI: The last spring freeze — how freeze probability thresholds are published.
- NOAA Climate.gov: Interactive map of average last spring freeze.
- National Weather Service glossary: frost, freeze, and hard freeze.
- University of Georgia Extension: Comparing advective and radiative freezes.
- USDA Plant Hardiness Zone Map (2023).
- USDA: How to use the plant hardiness maps — the map's stated limits and the acquired-hardiness mechanism.
- USDA Forest Service: Plant heat zones — the 86°F heat-day basis.
- University of Wisconsin Extension: Check soil temperature before planting — measurement depth and crop thresholds.
- Michigan State University Extension: Determine soil temperatures before planting — reading protocol and the effect of surface cover.
- UC Master Gardener Program: Seed germination temperature and timing — the tomato worked example.
- Oregon State University Extension: Soil temperature conditions for vegetable seed germination.
- Penn State Extension: Soil temperature and seed germination.
- Michigan State University: Calculating growing degree days.
- Cornell NEWA: About degree days.
- UC IPM: Pest and plant models.
- Michigan State University Extension: The limits of degree-day model precision.
- USA National Phenology Network: Status of Spring maps.
- UC Fruit and Nut Research Information Center: Chilling hours, units, and portions.
- UC: Chilling accumulation models and their calculation — why the Dynamic Model performs better.
- Clemson Cooperative Extension: Understanding chill hours for fruit and nut trees.
- University of Georgia Extension: Fall vegetable gardening — counting back from the first-frost date.
- University of Georgia Extension: Counting days to maturity for fall vegetables.
- Iowa State University Extension: Fall planting of vegetables.
- University of New Hampshire Extension: Using row covers in the garden.
- Colorado State University Extension, GardenNotes #722: Season extension — measured protection and the overheating risk.
- Michigan State University Extension: Row covers for frost protection and earliness.
- Penn State Extension: Transplanting annuals into the garden — hardening-off duration and physiology.
- Michigan State University Extension: Hardening off vegetable transplants.
- University of Georgia Extension: Succession planting intervals.